Understand how the system updates reorder points
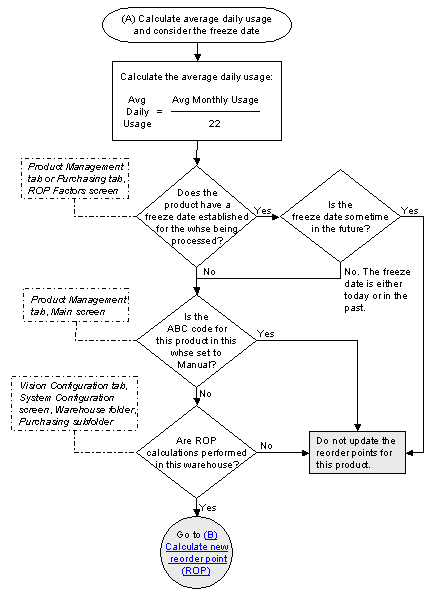
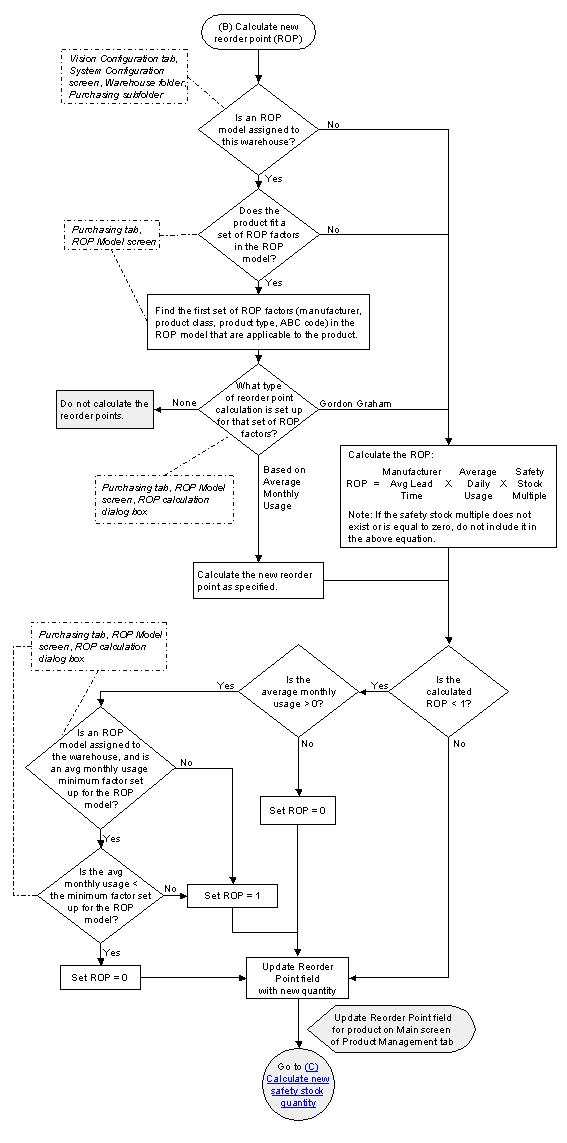
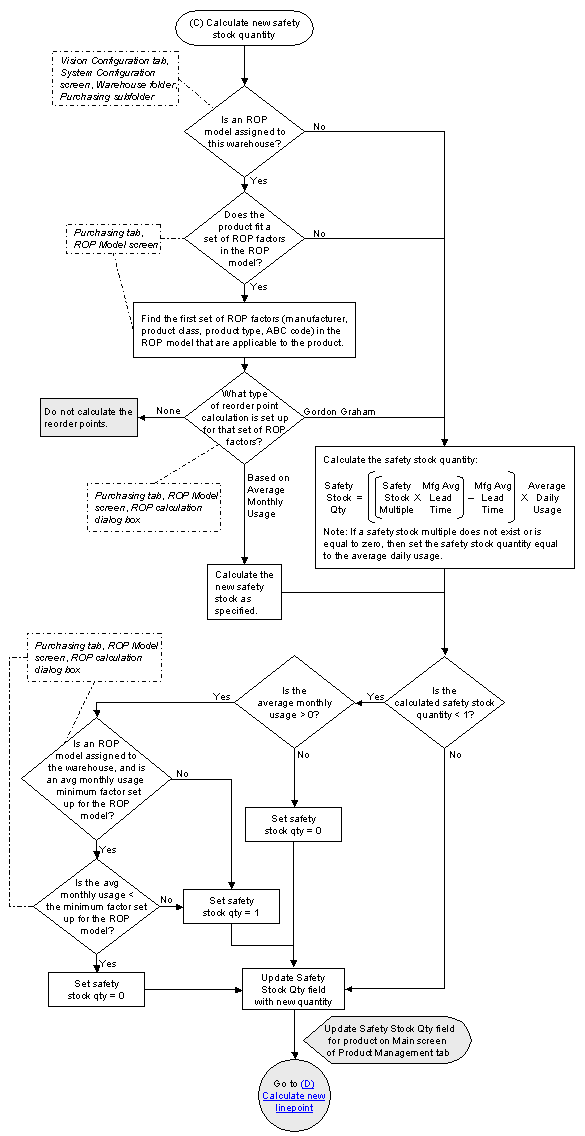
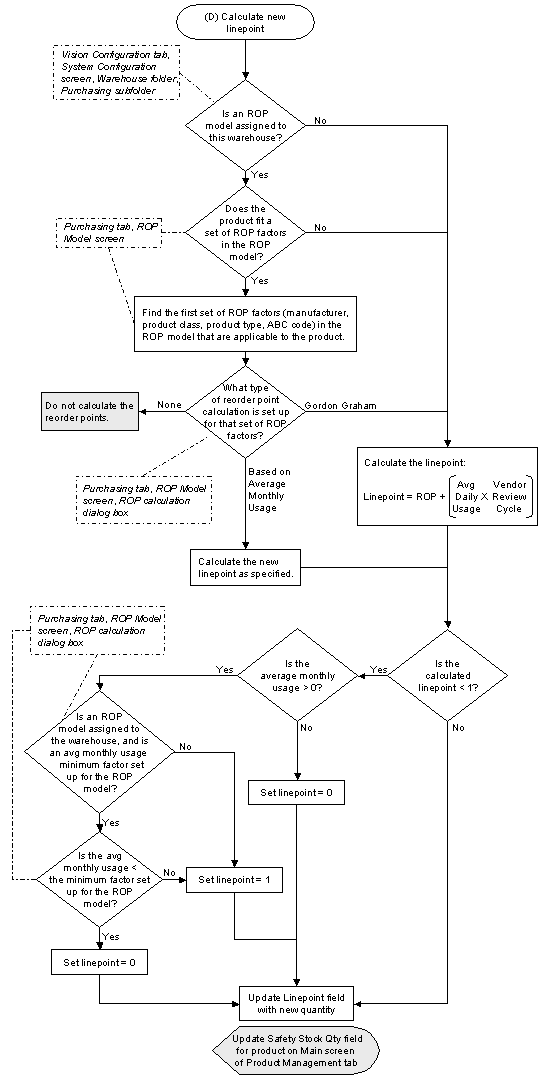
The following multi-part flow chart shows how the system recalculates replenishment factors. (To print the flow chart, click Printable Version to open a PDF version of the flow chart that is suitable for printing.)
(A) Calculate average daily usage and consider the freeze date

top
(B) Calculate new reorder point (ROP)

top
(C) Calculate new safety stock quantity

top
(D) Calculate new linepoint

top


